
Is RTK Enough for Stockpile Surveys?
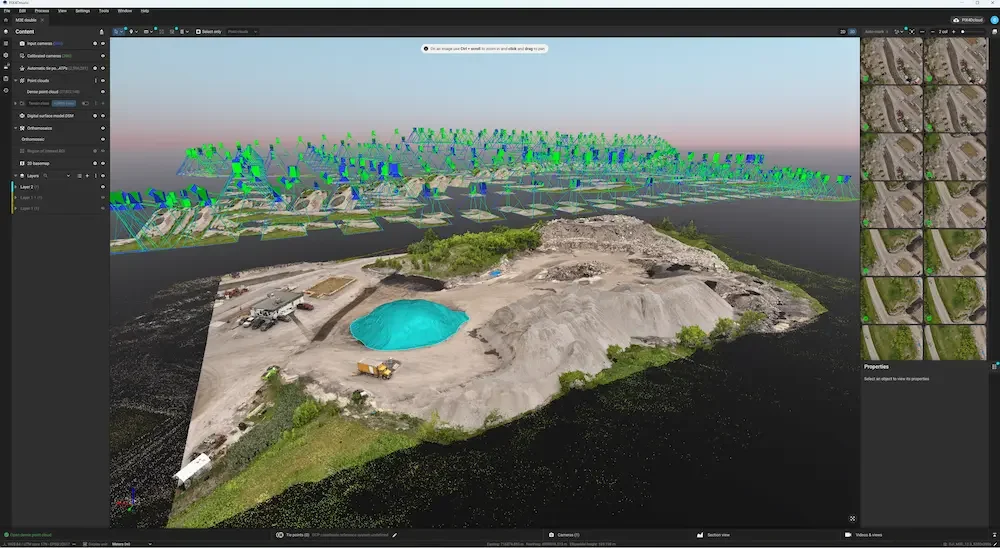
Screenshot of Drone Data Processing for a Stockpile Survey of Asphalt Plant
Testing DJI M3E vs Zenmuse P1 Accuracy Without Ground Control
On This Page
Key Findings
All four camera/flight combinations agreed within 0.16% on a 2,490 m³ stockpile
Operator redraw variance (0.8%) was 5x larger than equipment differences
For monthly inventory tracking, importing previous volume polygons eliminates redraw variance entirely
RTK-only workflows produce consistent results, but GCP validation is needed to confirm absolute accuracy
Table of Contents
Why I Ran This Test
Test Site and Equipment
Flight Parameters
Processing Setup
Precision vs Accuracy
Calibration Results
Understanding the RMS Values
Volumetric Comparison
Operator Variance
Practical Takeaways
What's Next
Why I Ran This Test
One of the most common questions I get from clients is whether they need ground control points for stockpile measurements. Setting up GCPs takes time, requires survey-quality GNSS equipment, and adds cost to every project.
I've processed hundreds of stockpile surveys using RTK-only workflows, and the results have always been consistent. But I wanted hard data to quantify exactly how much variance exists between different camera systems and flight patterns when relying solely on RTK positioning.
This test compares two cameras and two flight patterns, all processed without ground control, to measure the real-world consistency of RTK-only stockpile volumetrics.
*Before we continue, please read this website's disclaimer on the use of the word "survey".
Test Site and Equipment
The test site is an asphalt production facility with multiple material stockpiles. We frequently work with aggregate producers and asphalt plants across Southern Ontario for monthly inventory tracking. The terrain includes roughly 15 to 20 meters of elevation change across the stockpile areas, with conical piles, sloped surfaces, and a mix of materials including aggregate, sand, and recycled asphalt.
This type of terrain is where double grid flights are typically recommended, as single grid patterns can miss detail on sloped surfaces.
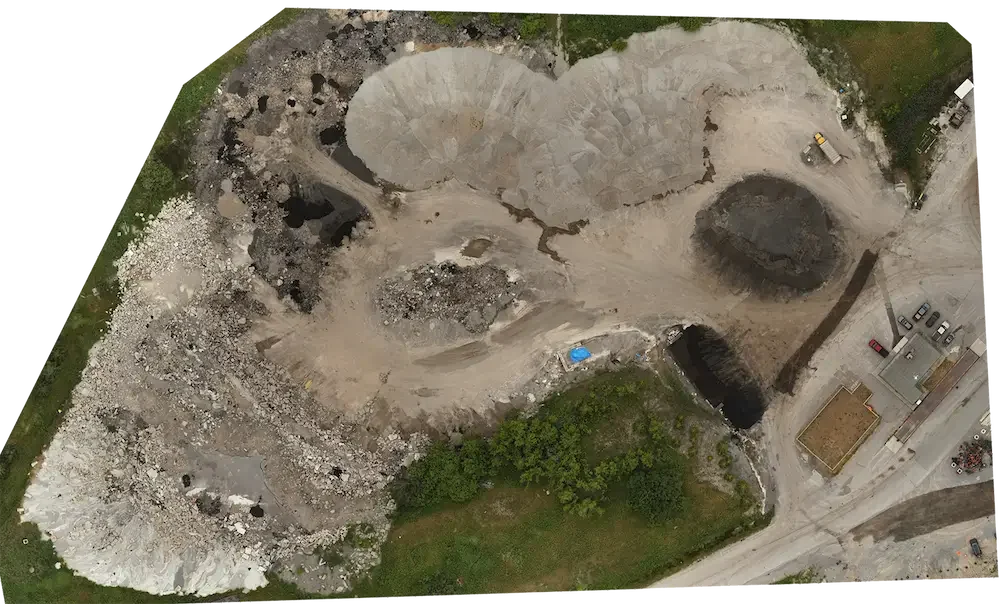
Orthomosaic overview of the asphalt plant site showing stockpile locations
Cameras Tested
DJI Mavic 3 Enterprise (M3E)
20MP sensor (1/2" CMOS)
5280 x 3956 pixels
Integrated RTK module
DJI Zenmuse P1 on M300 RTK
45MP full-frame sensor
8192 x 5460 pixels
24mm lens
The P1 offers more than double the resolution and a significantly larger sensor. The question is whether that translates to meaningfully better volumetric results.
RTK Setup
Both systems used the same RTK base station for all flights, providing consistent positioning across all four datasets. No GCPs were used in processing.
Flight Parameters
We flew four missions: single and double grid patterns with each camera. All flights used terrain follow mode with ASTER DEM data.
| Parameter | M3E | P1 |
|---|---|---|
| Front Overlap | 75% | 75% |
| Side Overlap | 85% | 85% |
| Flight Altitude | 50m AGL | 80m AGL |
| GSD | 1.4-1.5 cm | 1.3-1.4 cm |
The P1 flies higher to achieve similar GSD due to its longer focal length and larger sensor, resulting in fewer flight lines for equivalent resolution.
The M3E flights were planned specifically for the test area, while the P1 flights covered the full asphalt plant. A Region of Interest (ROI) was applied during processing to match coverage areas. The measured stockpile is well inside all flight boundaries, ensuring consistent overlap and image quality across all four datasets.
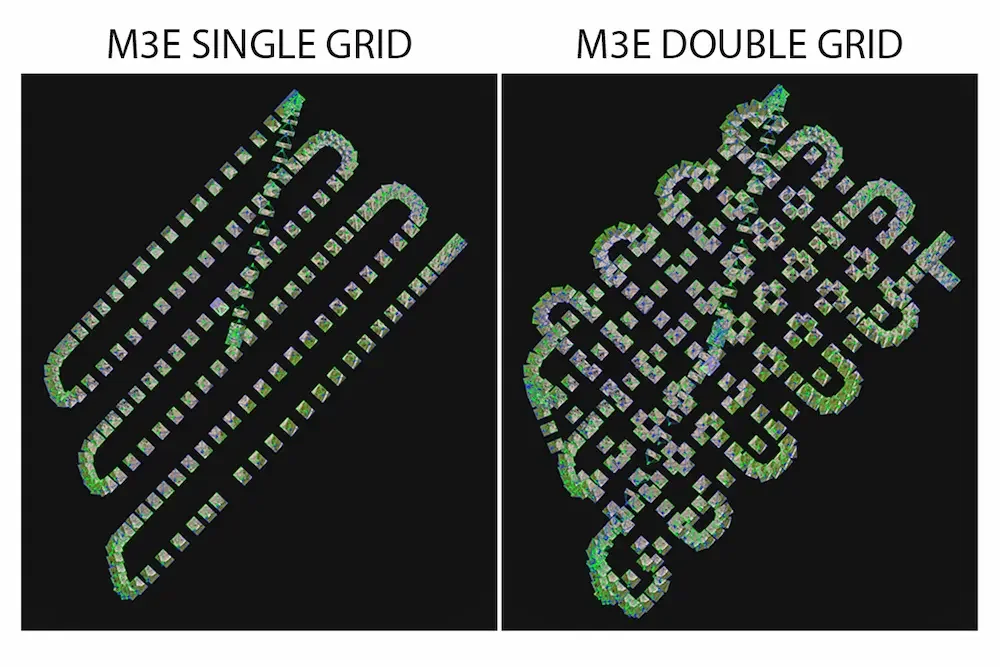
Side-by-side flight pattern comparison showing single vs double grid camera positions
Processing Setup
All processing was completed in Pix4Dmatic 2.0 using identical settings. For details on our processing workflows, see our Drone Data Processing services.
| Setting | Value |
|---|---|
| Template | Map |
| Pipeline | Trusted location and orientation |
| Image Scale | 1 (calibration), 1/2 (dense cloud) |
| Density | Optimal |
| Coordinate System | WGS 84 / UTM zone 17N |
Hardware
AMD Ryzen Threadripper 7970X (32-core)
128GB RAM
NVIDIA RTX 4080 Super
Windows 11
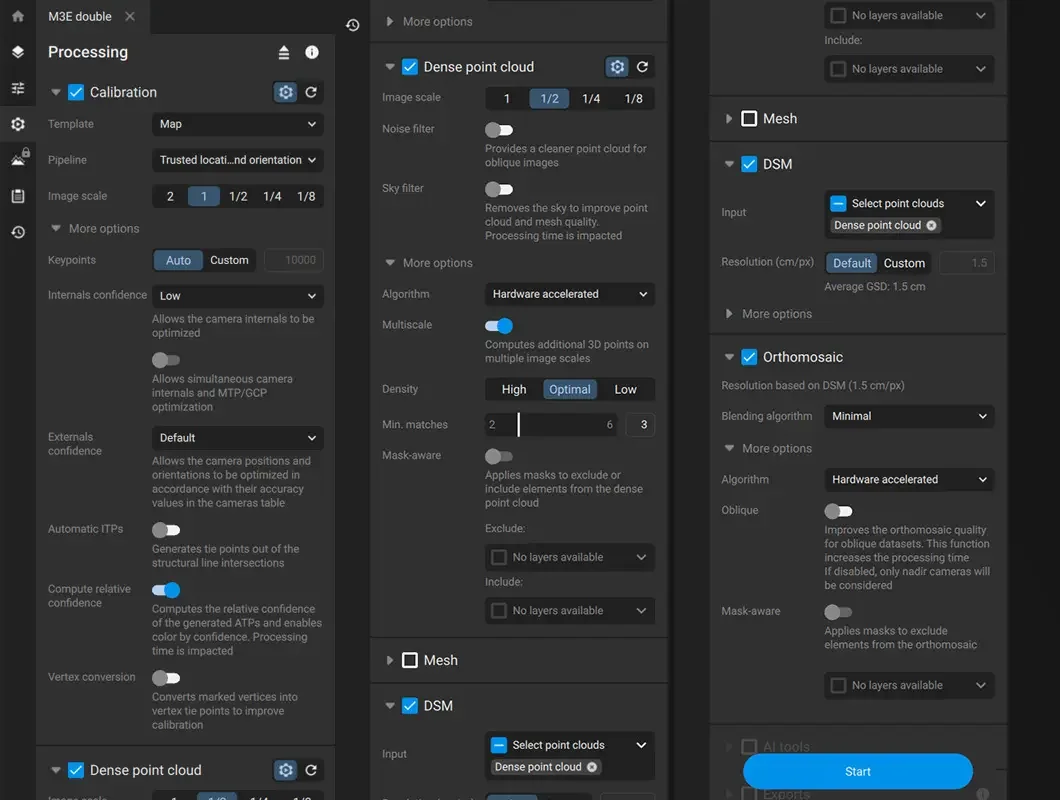
Screenshot of Pix4Dmatic processing settings
Precision vs Accuracy
Before presenting results, it's worth clarifying terminology.
The RMS values reported by Pix4Dmatic measure what ASPRS Positional Accuracy Standards (Edition 2, 2024) call "data internal precision": how well points within the dataset relate to each other. This is distinct from "absolute accuracy," which measures how close positions are to true ground coordinates verified by independent checkpoints.
This test uses RTK positioning, via local RTK-Base Station with no ground control points. Without checkpoints, we cannot make claims about absolute accuracy for this test. What we can establish is whether RTK-only workflows produce consistent, repeatable results across different equipment and flight patterns.
Consistency is the prerequisite for accuracy. If four different setups produce wildly different volumes, accuracy is impossible regardless of ground control. If they agree closely, accuracy becomes a matter of calibration and validation.
Part 2 of this series adds surveyed GCPs to determine whether this consistency translates to absolute accuracy.
Calibration Results
All four datasets achieved 100% calibration with a single block.
| M3E Single | M3E Double | P1 Single | P1 Double | |
|---|---|---|---|---|
| Images | 193 | 396 | 298 | 707 |
| GSD | 1.4 cm | 1.5 cm | 1.3 cm | 1.4 cm |
| Dense Points | 19.1M | 27.8M | 22.4M | 38.3M |
| RMS X | 0.6 cm | 1.0 cm | 0.6 cm | 0.8 cm |
| RMS Y | 0.9 cm | 1.2 cm | 1.0 cm | 1.0 cm |
| RMS Z | 0.8 cm | 1.7 cm | 0.6 cm | 0.8 cm |
| Processing Time | ~8 min | ~18 min | ~18 min | ~57 min |
All RMS values are sub-2cm, representing strong internal precision for commercial stockpile work.
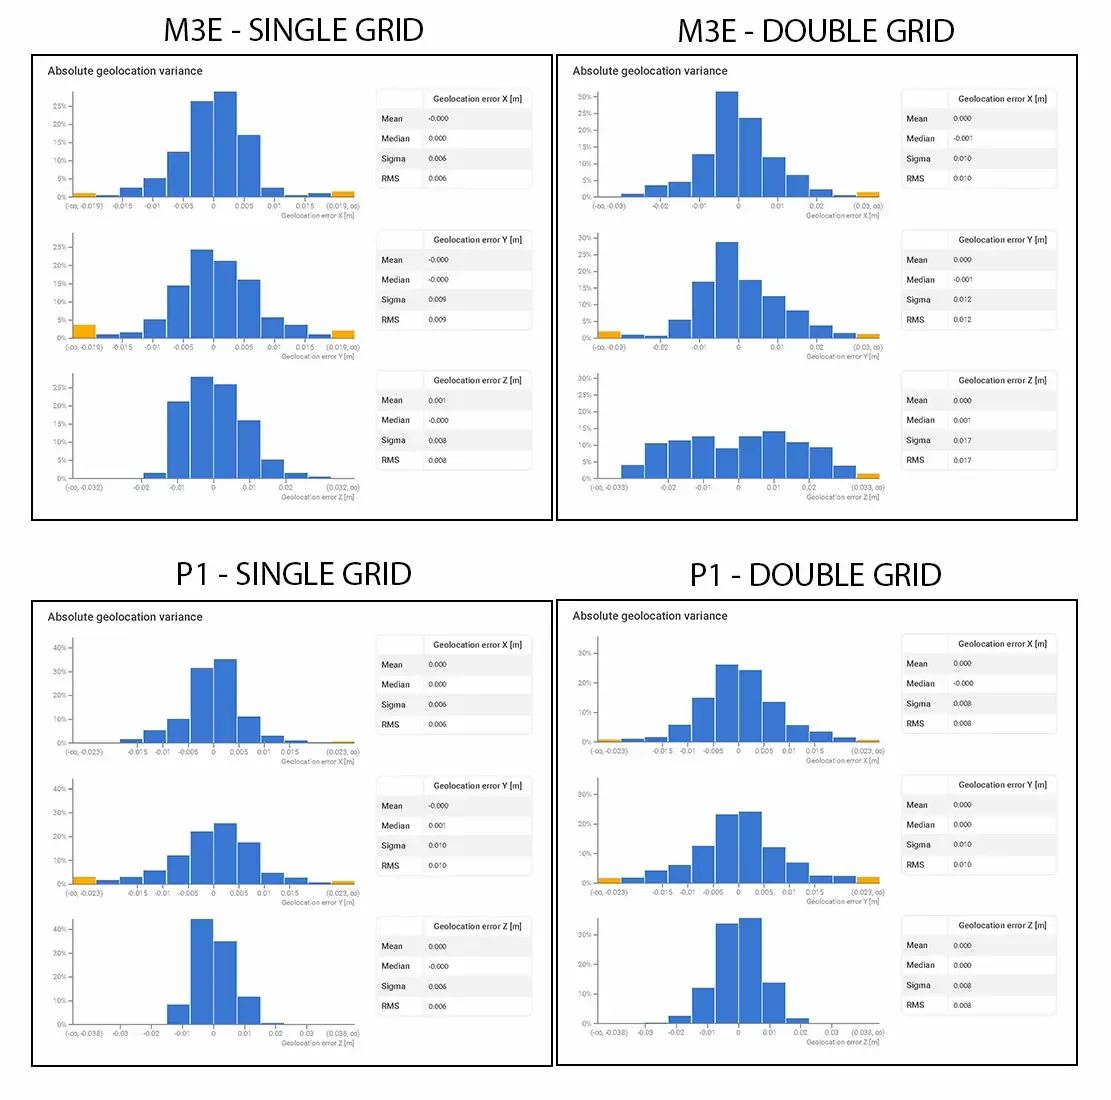
Quality report geolocation error screenshots in 2x2 grid - M3E Single, M3E Double, P1 Single, P1 Double
Understanding the RMS Values
The double grid flights show higher RMS values than single grid across both cameras. This requires explanation, as double grid is typically expected to produce better results.
The RMS values in Pix4Dmatic quality reports measure geolocation error: the difference between the initial RTK camera positions and the optimized positions after bundle adjustment. This indicates how much the software adjusted the cameras during optimization, not ground accuracy.
Double grid patterns create perpendicular flight lines with cross-track tie points. The optimizer must satisfy more geometric constraints simultaneously. Any systematic error in RTK positioning, such as drift or IMU bias, becomes apparent when reconciling the conflicting geometry from perpendicular passes. The software makes larger adjustments to resolve these conflicts.
Single grid flies one direction consistently, so systematic errors remain undetected. The optimizer has less contradictory data to reconcile, resulting in smaller adjustments.
Higher camera adjustment RMS in double grid may indicate the software is correcting errors that single grid cannot detect. Ground accuracy could actually be better despite the higher RMS values. Verifying this requires GCP validation, which is covered in Part 2.
Volumetric Comparison
Calibration metrics are useful, but the practical question is volumetric consistency. I measured the same stockpile across all four datasets using two methods.
Test stockpile specs:
Footprint: 828 m²
Height: 1.4 m
Volume: ~2,490 m³

Overview showing the measured stockpile location within the site
Method 1: Imported Polygon
I drew a volume boundary on the P1 double grid dataset, exported the polygon as a shapefile, and imported it into the other three projects. This applies the same boundary vertices and base plane to four different point clouds.
| Dataset | Cut Volume (m³) |
|---|---|
| M3E Single | 2,497.90 |
| P1 Double | 2,489.35 |
| P1 Single | 2,487.05 |
| M3E Double | 2,481.83 |
Range: 16.1 m³ (0.6%)
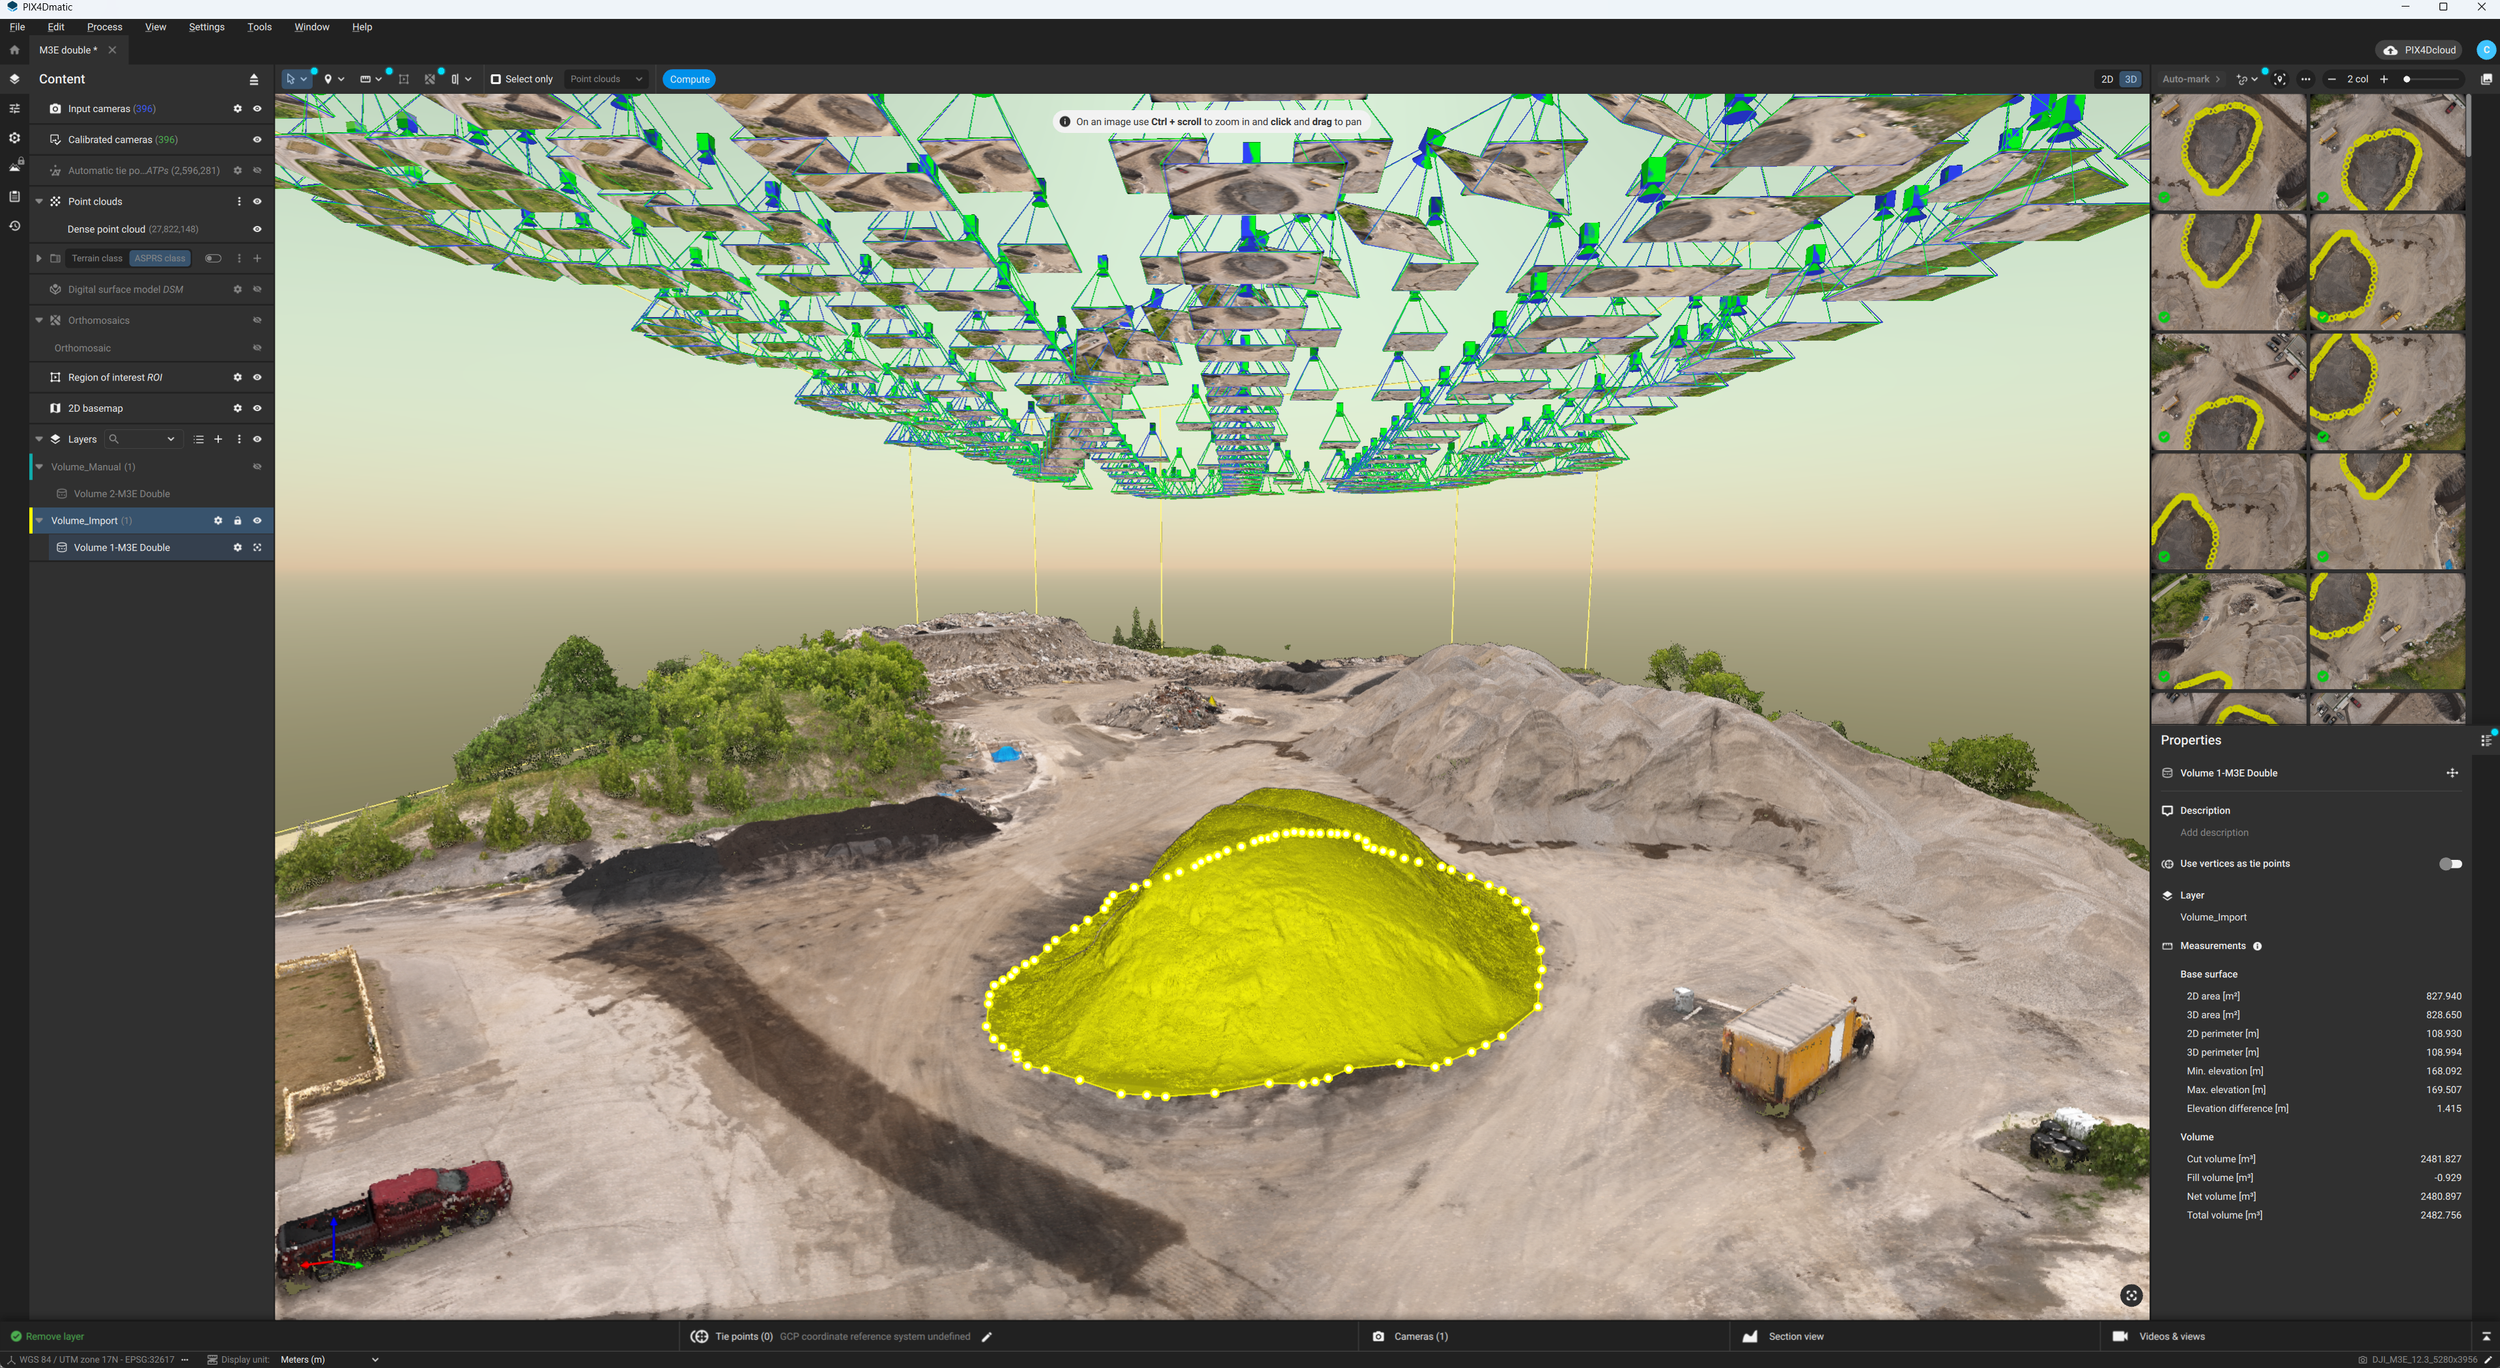
Screenshot of imported volume polygon on one of the datasets
All four datasets agree within 0.6% on a ~2,490 m³ stockpile.
This method has one limitation: imported polygon vertices may not align perfectly with each dataset's ground surface. The base plane could sit slightly above or below the actual ground, introducing systematic offset.
However, this limitation reveals a practical advantage. For monthly stockpile monitoring where pile locations remain consistent, importing the previous month's volume polygons eliminates redraw variance entirely. As long as the RTK base station setup remains consistent between visits, the coordinate system alignment holds.
Method 2: Manually Redrawn Polygons
To eliminate base plane alignment issues, I manually redrew the volume boundary in each project, snapping vertices to each dataset's own point cloud.
| Dataset | Cut Volume (m³) |
|---|---|
| M3E Single | 2,490.20 |
| P1 Single | 2,489.52 |
| P1 Double | 2,488.56 |
| M3E Double | 2,486.22 |
Range: 4.0 m³ (0.16%)
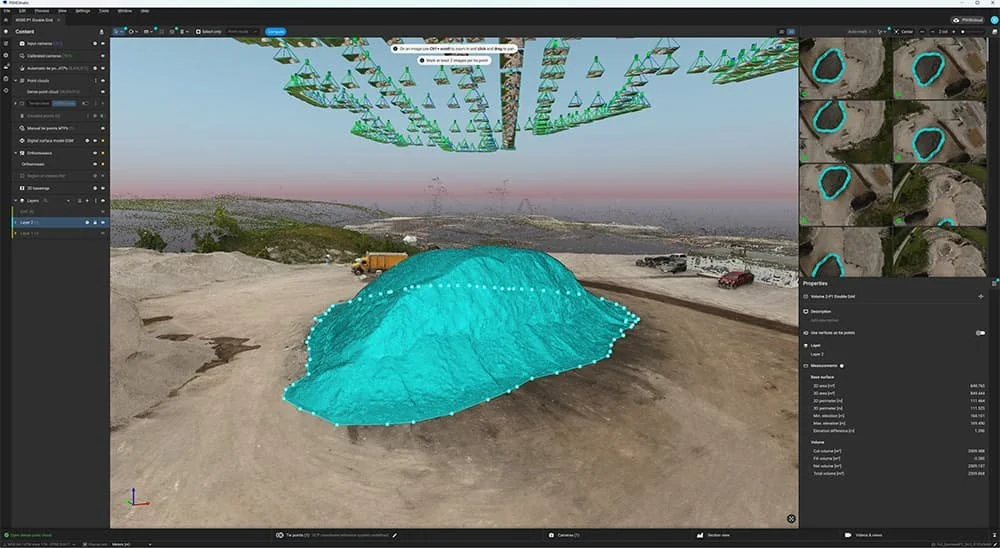
Screenshot of manually drawn volume with measurement results
When each volume is drawn on its own surface, the four datasets agree within 4 cubic meters, or 0.16% variance across two different cameras and two different flight patterns.
These results reflect one site under good GNSS conditions. Weaker satellite geometry, multipath interference, or challenging terrain could produce larger discrepancies on other sites.
For reference, 4 m³ is approximately one quarter of a tandem dump truck load.
Operator Variance
To establish a baseline for comparison, I drew the same volume twice on the P1 double grid dataset.
| Attempt | Cut Volume (m³) |
|---|---|
| First draw | 2,509.49 |
| Second draw | 2,488.56 |
Difference: 20.9 m³ (0.8%)
Manual redrawing variance on the same dataset (0.8%) exceeds the variance across all four camera and flight pattern combinations (0.16%) by a factor of five.
Operator drawing consistency introduces more variance than equipment or flight pattern selection.
Summary of Variance Sources
| Source | Variance | Notes |
|---|---|---|
| Camera and flight pattern | 0.16% | 4 m³ on 2,490 m³ pile |
| Imported polygon method | 0.6% | 16 m³, includes base plane offset |
| Operator redraw | 0.8% | 21 m³, same dataset drawn twice |
Drawing consistency matters more than equipment choice.
Practical Takeaways
For Monthly Stockpile Monitoring
For repeat surveys on consistent stockpile locations, the imported polygon method reduces operator redraw variance. We use this approach for clients from Windsor to Ottawa who need monthly volumetric tracking.
Draw volume boundaries once, export them, and import into each subsequent survey. This depends on consistent RTK base station setup between visits and obviously better for bays
For Camera Selection
The P1 produces marginally tighter internal precision, particularly in the Z axis. However, the differences are measured in millimeters. For commercial stockpile volumetrics, M3E results are statistically indistinguishable from the P1.
For Flight Pattern Selection
On this site with 15-20m elevation change and sloped stockpile surfaces, single grid performed equivalently to double grid for volumetric measurements. The additional flight time for double grid did not produce meaningfully different results.
Double grid remains valuable for 3D modeling, facade capture, and sites with complex vertical structures. For nadir stockpile volumetrics on typical aggregate or asphalt sites, single grid is sufficient.
For GCP Usage
This test demonstrates that RTK-only workflows produce consistent results. All four datasets agree with each other. Whether they agree with ground truth is a separate question.
For relative measurements such as inventory tracking between visits, consistency is the primary requirement. For absolute measurements tied to legal or contractual obligations, GCP validation remains advisable.
Strong RTK numbers don't override legal requirements. Depending on your jurisdiction, formal surveys may require a licensed surveyor, specific control standards, and documented methodology, regardless of how clean your data looks. Know your local requirements before delivering work that carries legal or contractual weight.
What's Next
This was Part 1 of a two-part series focused on internal consistency without ground control.
Part 2 will cover a quarry dataset that includes surveyed ground control points. The same camera and flight pattern comparisons will be validated against known coordinates to determine whether RTK positioning is accurate enough, or only precise enough.
[Part 2 - Coming Soon]
Questions?
If you have experience comparing RTK-only workflows against GCP-controlled surveys, I'm interested in hearing about the variance you observe on your sites.
All the best,
Craig