
Drone Mapping
Aerial drone surveys, mapping, and photogrammetry for commercial projects. Centimetre-level RTK accuracy delivers orthomosaics, point clouds, and volumetric measurements you can act on.
Request a Quote →Accurate Spatial Data, Faster
A drone survey captures detailed aerial data of your site using photogrammetry, LiDAR, and precise RTK positioning. The result is accurate, georeferenced drone maps and 3D models that support planning, monitoring, volumetric analysis, and progress documentation across construction, aggregates, land development, and environmental projects.
Whether you need a topographic drone survey, a volumetric stockpile measurement, or high-resolution orthomosaics, we match the capture method to your project. We use both photogrammetry (RGB imagery) for photorealistic outputs and LiDAR for dense point clouds that penetrate vegetation.
Mapping Solutions
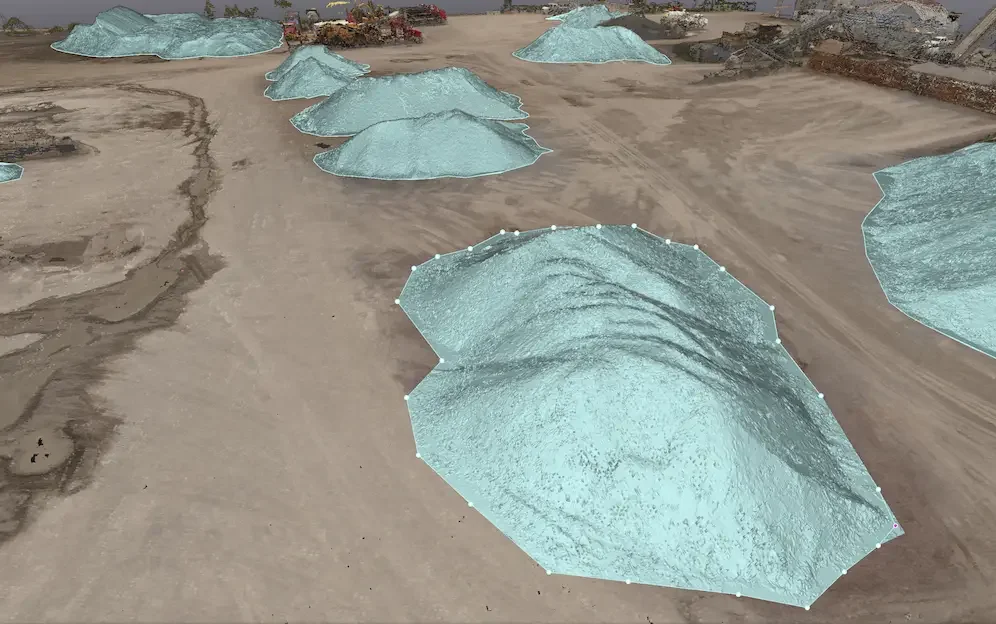
Stockpile Measurements
Volumetric drone surveys for aggregates, mining, construction, and waste management. Measure stockpile volumes in hours with 1–3% accuracy.
Learn More
Data Processing
Professional photogrammetry and LiDAR processing to transform raw aerial data into orthomosaics, point clouds, 3D models, and CAD-ready deliverables.
Learn MoreDeliverables
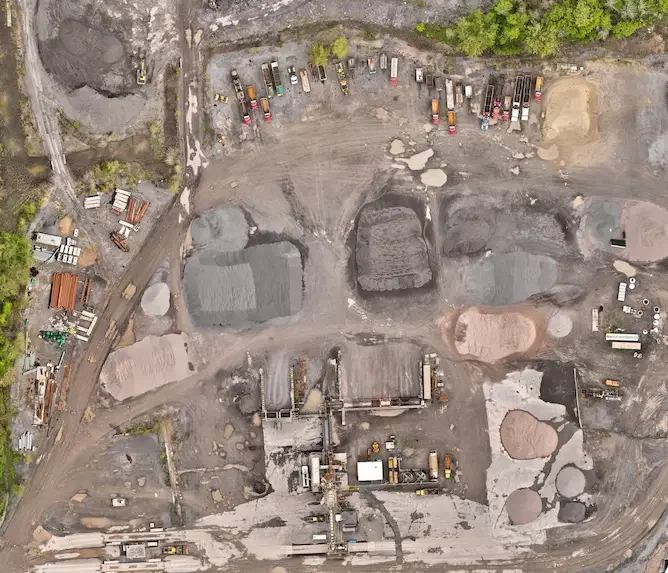
Orthomosaics
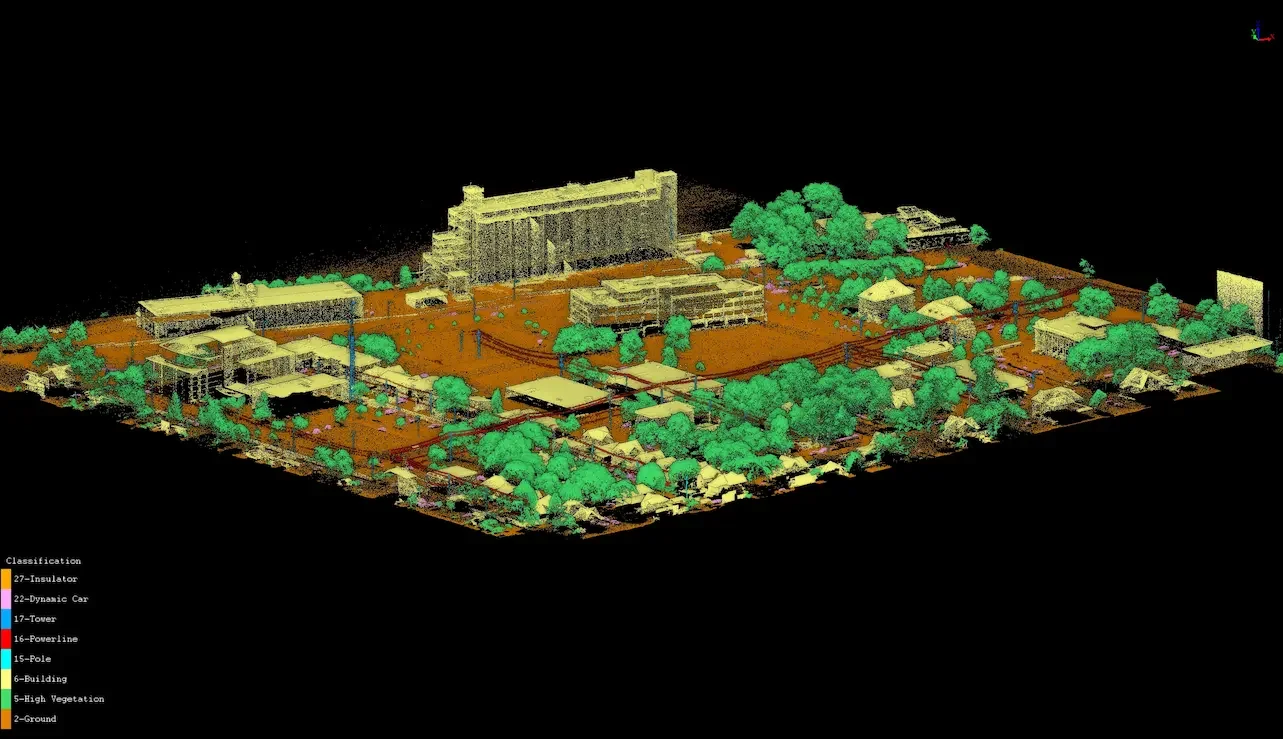
Point Clouds
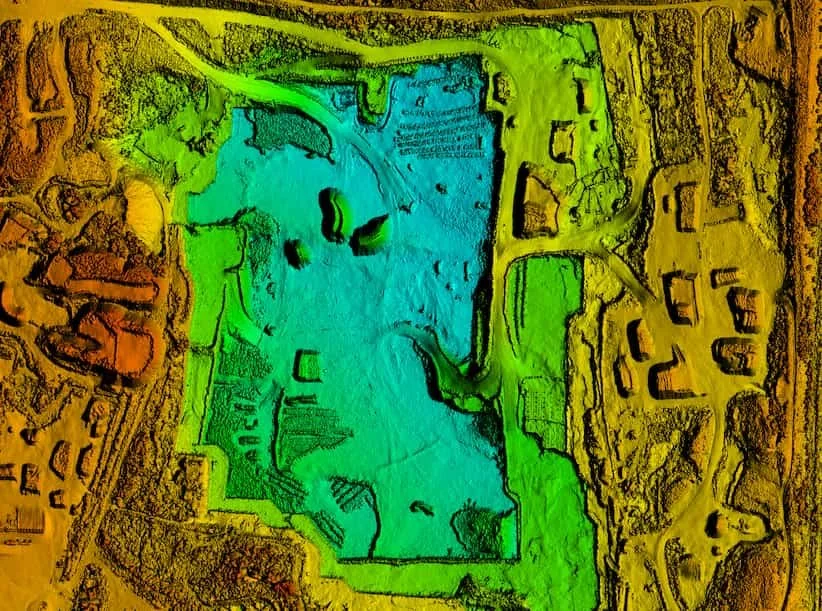
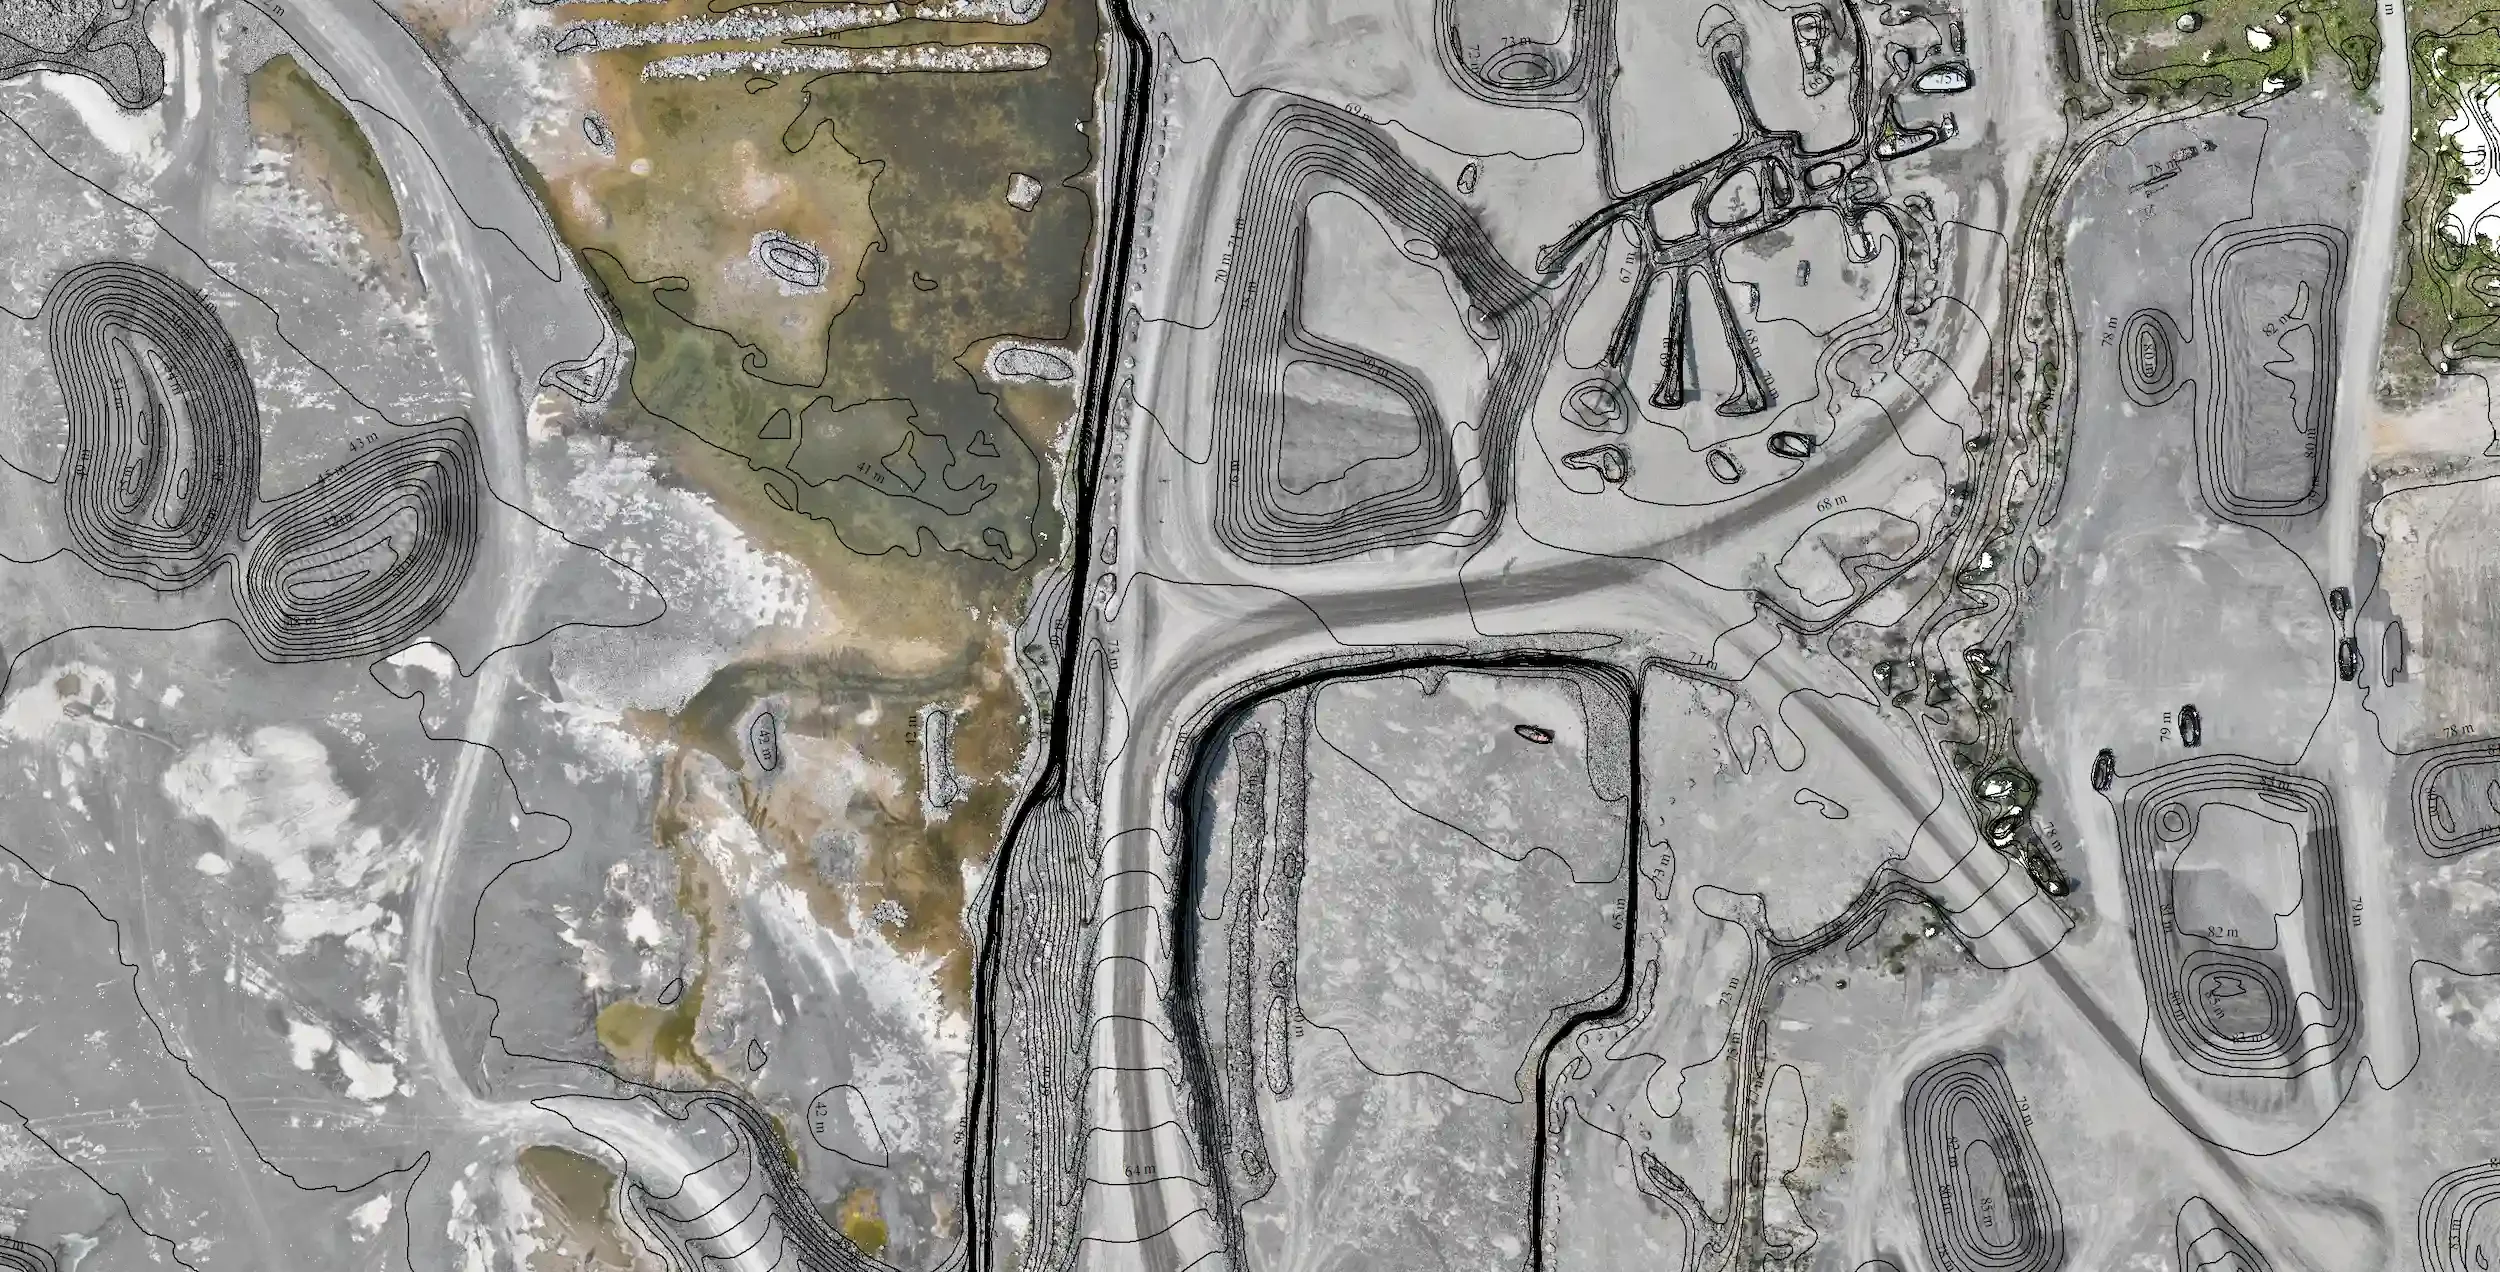
Elevation Models

CAD & GIS Exports
Industries We Serve
Construction
Aggregates & Mining
Land Development
Environmental
The Difference
Centimetre-Level Accuracy
RTK/PPK positioning and ground control points deliver 1–3 cm accuracy, suitable for engineering, planning, and topographic drone survey applications.
Fast Turnaround
Most drone survey projects delivered within 1–2 business days. Same-day delivery available for urgent requirements.
Multiple Capture Methods
Photogrammetry and LiDAR capabilities let us match the right technology to your specific project needs.
Common Questions
What is drone mapping?
Drone mapping uses aerial imagery and sensors to create accurate maps, models, and measurements of a site. Drones fly autonomously over an area, capturing overlapping images or LiDAR data that is then processed into georeferenced deliverables like orthomosaics, point clouds, and elevation models.
What's the difference between drone mapping and a drone survey?
In practice, these terms are used interchangeably by most clients. A drone survey and drone mapping both describe capturing aerial data with a drone to produce measurements, maps, and 3D models of a site. Engineers and surveyors often use "drone survey," while construction and GIS teams often lean toward "drone mapping." We deliver the same outputs regardless of which term you use.
How accurate is a drone survey?
With RTK/PPK positioning and ground control points, we typically achieve 1–3 cm horizontal and vertical accuracy. Accuracy depends on flight parameters, ground control, and site conditions. We discuss your specific accuracy requirements during project planning to ensure the capture method matches your deliverable needs.
Can a drone survey replace a traditional land survey?
For most commercial use cases, including topographic mapping, volumetric measurement, progress monitoring, and site planning, a drone survey is faster, safer, and often more detailed than traditional ground methods. However, legal boundary surveys, property surveys registered with the land registry, and other cadastral work must be performed by a licensed Ontario Land Surveyor (OLS). Holland Productions is not an OLS.
What's the difference between photogrammetry and LiDAR?
Photogrammetry uses overlapping photos to reconstruct 3D geometry and produces photorealistic textures. LiDAR uses laser pulses to measure distances directly, producing dense point clouds that can penetrate vegetation. We often recommend LiDAR for forested areas or when you need bare-earth terrain data.
How large an area can you map?
We regularly map sites ranging from a few acres to hundreds of hectares. For very large drone survey projects, we can deploy multiple flights over several days. The limiting factors are typically battery life and airspace regulations rather than technical capability.
What deliverables do you provide?
Standard drone survey deliverables include orthomosaics (GeoTIFF), point clouds (LAS/LAZ), digital elevation models (DSM/DTM), contour lines, and PDF reports. We also provide CAD exports (DXF/DWG), 3D models, and volume calculations depending on project requirements.
How long does a drone survey project take?
Field work for most sites takes a few hours to a full day depending on size and complexity. Processing and delivery typically takes 1–2 business days for standard projects. We can accommodate rush timelines when needed.
Ready to Map Your Site?
From stockpile volumes to topographic drone surveys, we deliver the accurate spatial data you need.
Request a Quote →Related Articles & Guides

Drone Mapping in Windy Conditions:
Best Practices for Efficient Data Collection
CONTACT
Request a Quote
Fill out the form below and we'll get back to you within one business day.